Problem & Approach.
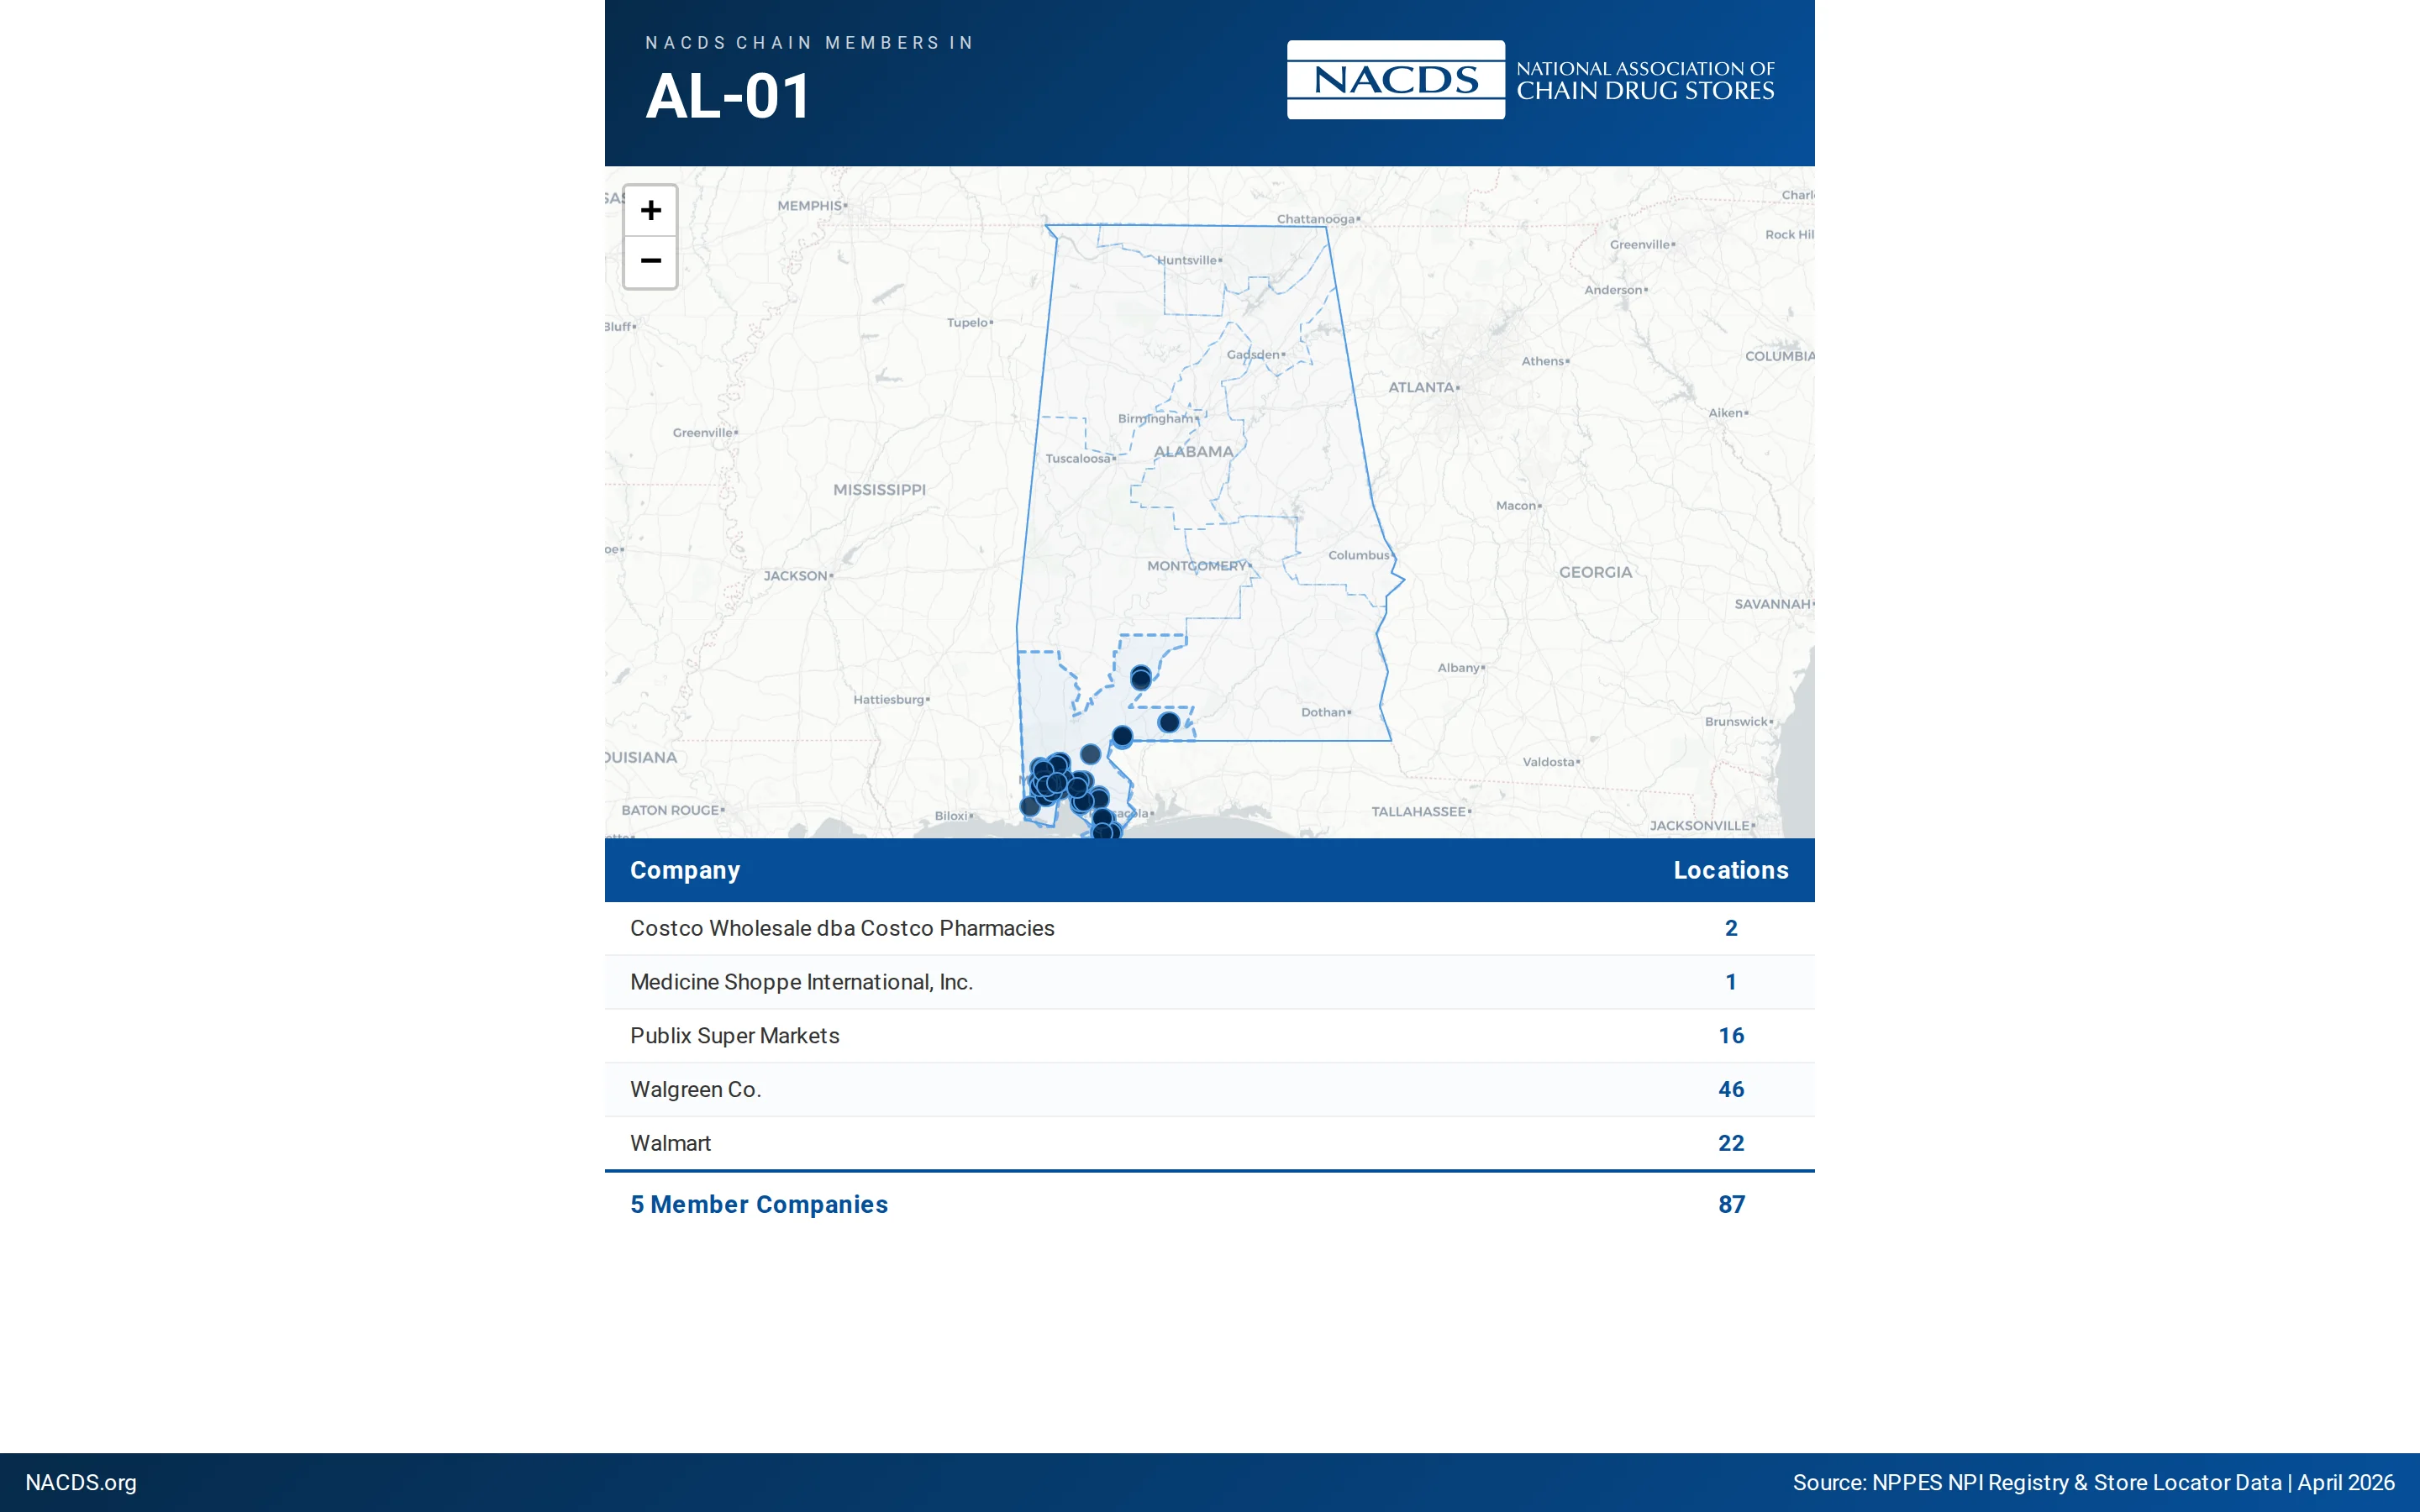
NACDS members get a per-state advocacy briefing — store counts, top-performing chains, KPI dashboard, state map. The old process generated these manually per state, slowly. I built a Python pipeline that takes a single companies.json (60 NACDS chain members, 23,750 verified store locations from web scraping) and emits 51 print-optimized HTML pages (one per US jurisdiction) with the KPI dashboard, location map (Leaflet), and chain list inline. Print CSS handles the page-break geometry. Bulk regenerate via the Command Center.
Outcome.
51 jurisdictions, regenerated on demand. The NACDS member-state operations team uses these for advocacy briefings. The single-source-of-truth design means a data update propagates to all 51 pages plus the maps and Excel files in one pipeline run.