Problem.
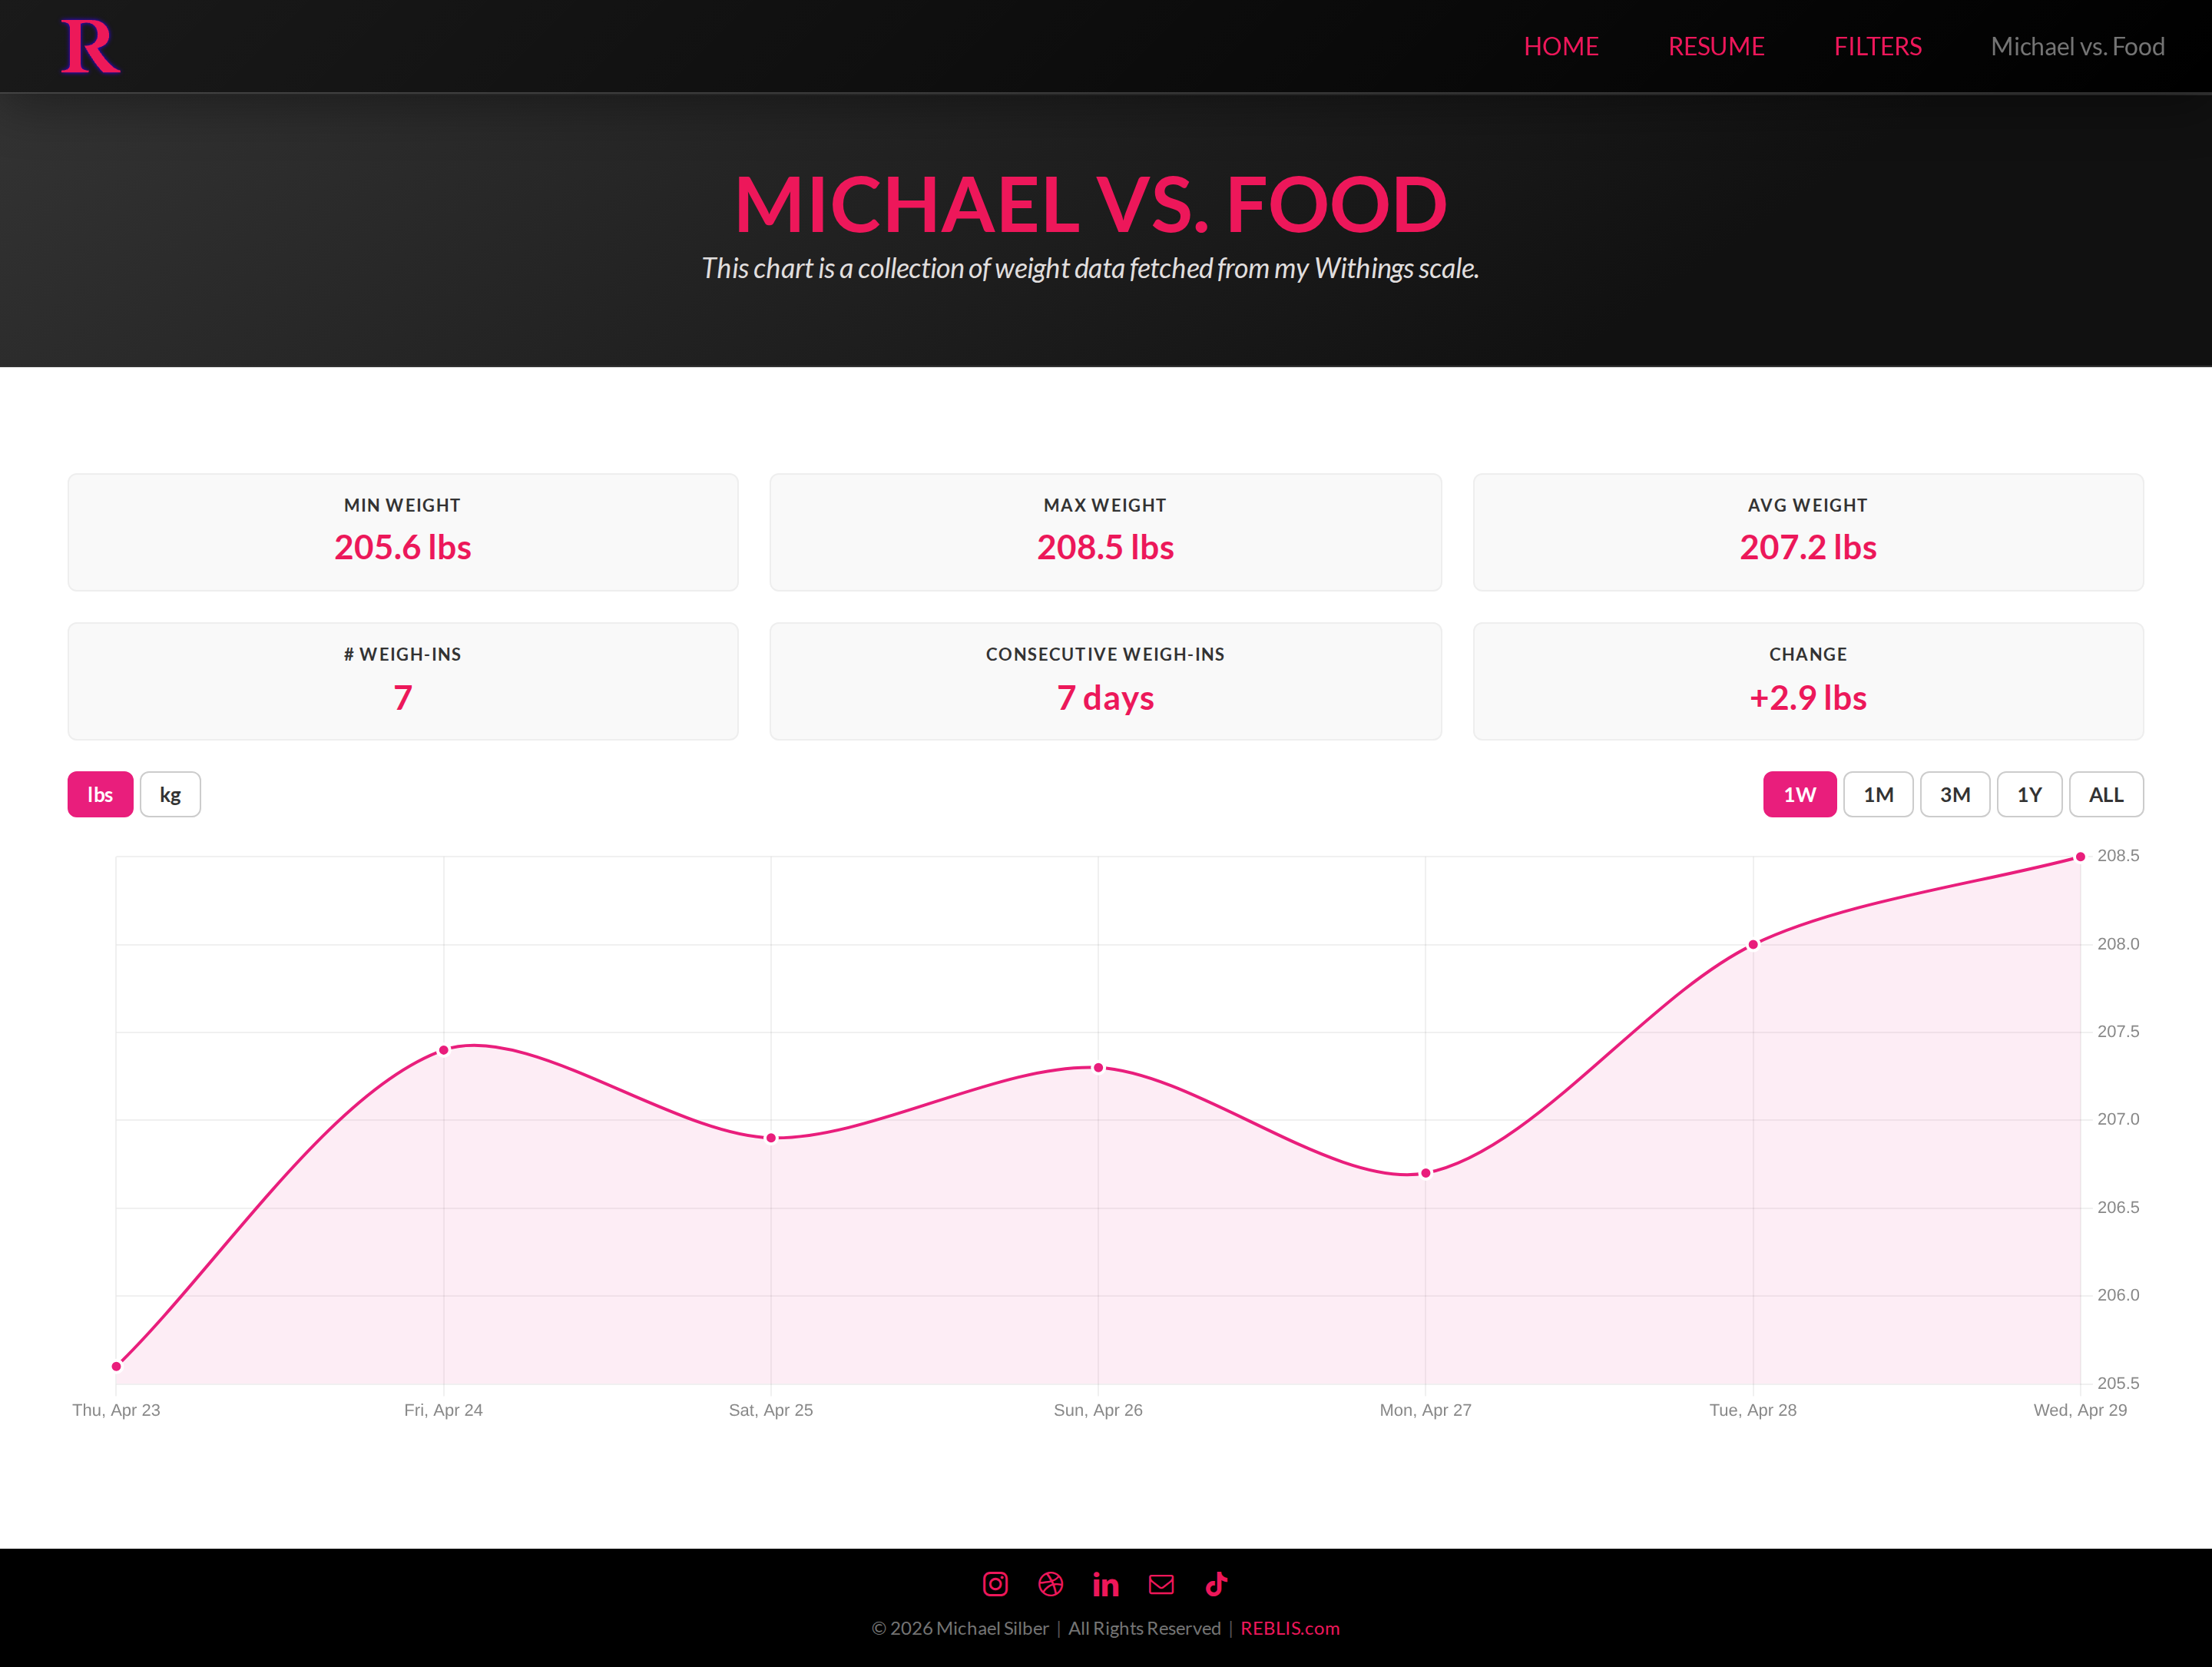
Two data sources I cared about — daily weight from a Withings smart scale and intermittent fasts I clicked start/stop on — lived in different silos. I wanted one chart where a fast appears as a colored band and weight as a line, so the question "did the fast actually correlate with a drop?" was answerable in one glance.
Approach.
A Node service polls the Withings OAuth API and dumps to JSON. A fasts.csv records start/stop timestamps manually (no app needed — I just edit the file). Chart.js renders both layers: a line chart for weight, with the chartjs-plugin-annotation handling shaded fast bands at exact timestamps. Embedded into the existing reblis.com WordPress site via iframe so it lives where I check it most.
Outcome.
Live since 2026-03, never crashed, ~20 fasts logged, weight trending. Embedded into reblis.com/michael-vs-food/ for daily check-ins. The shaded-band visual answered the question — yes, fasts work, but the trendline takes weeks to show it. Phase 4 of the Reblis.ai project will restyle this widget into the new design tokens.
Gallery.